Debugging failures in a CI pipeline can often be more difficult than we would like. Tests can fail for unexpected reasons and we’re often left at the mercy of the error logging of the test which points you in the right direction but doesn’t enable quick investigation. Frequently developers are left needing to reproduce and investigate. This is even worse if a failure is intermittent and of course it only triggers on the CI system. In this post I’m going to talk about how I’m using the Troubleshoot project to help with this.
Troubleshoot
The Troubleshoot project is an open source project to provide diagnostic tools for working with Kubernetes. For this article I’m not going to focus on the analysis features but on the collection of logs and cluster information. In particular if configured correctly the support bundle that is captured from a Troubleshoot run can be used with another project sbctl to review the cluster with kubectl as if you had direct access to the cluster.
The sbctl tool emulates the API server and returns value from the support bundle captured by Troubleshoot. You can list pods, events, and even review logs allowing you to review what a cluster looked like at a point in time. Combining these make for a really compelling way to capture what has gone wrong in CI systems long after the test is done and cluster has been destroyed.
Github Action
The full Github workflow for a simple lint and test pipeline is:
name: Lint and Test Charts

on: pull_request

jobs:
  lint-test:
    runs-on: ubuntu-latest
    steps:
      - name: Checkout
        uses: actions/checkout@v2
        with:
          fetch-depth: 0

      - name: Set up Helm
        uses: azure/setup-helm@v1
        with:
          version: v3.8.1

      # Python is required because `ct lint` runs Yamale (https://github.com/23andMe/Yamale) and
      # yamllint (https://github.com/adrienverge/yamllint) which require Python
      - name: Set up Python
        uses: actions/setup-python@v2
        with:
          python-version: 3.7

      - name: Set up chart-testing
        uses: helm/chart-testing-action@v2.2.1
        with:
          version: v3.7.1

      - name: Run chart-testing (lint)
        run: ct lint --config ct.yaml --chart-dirs . --charts .

      - name: Create kind cluster
        uses: helm/kind-action@v1.5.0

      # --skip-clean-up isn't currently released
      #- name: Run chart-testing (install)
      #  id: install
      #  run: ct install --config ct.yaml --chart-dirs . --charts . --skip-clean-up

      # Manually doing install and wait since chart-testing is removing the cluster
      - name: install chart
        id: install
        run: helm install -n default ci . -f values.yaml

      - name: wait for pods
        run: kubectl wait --for=condition=ready -n default po --all --timeout=60s

      - name: wait for pvc
        run: kubectl wait --for=jsonpath='{.status.phase}'=Bound -A pvc --all --timeout=10s

      - name: wait for pv
        run: kubectl wait --for=jsonpath='{.status.phase}'=Bound -A pv --all --timeout=10s

      - name: test chart
        id: test
        run: helm test ci

      - name: install troubleshoot
        run: curl -L https://github.com/replicatedhq/troubleshoot/releases/latest/download/support-bundle_linux_amd64.tar.gz | tar xzvf -
        if: success() || failure()

      - name: collect bundle
        run: ./support-bundle --interactive=false -o ci-bundle https://raw.githubusercontent.com/replicatedhq/troubleshoot-specs/main/host/cluster-down.yaml https://raw.githubusercontent.com/replicatedhq/troubleshoot-specs/main/in-cluster/default.yaml
        if: success() || failure()

      - name: Upload support bundle artifact
        uses: actions/upload-artifact@v3
        if: success() || failure()
        with:
          name: support-bundle
          path: 'ci-bundle.tar.gz'
Most of this workflow is using actions available as open source actions shared on Github. It checks out the code, adds dependencies (Helm and chart-testing), lints the chart, and then deploys it. These steps aren’t relevant to the troubleshoot portion but are included to have a full example.
The last 3 sections are the ones of interest here and could be added to any CI system in a similar fashion. The step install troubleshoot just uses a curl command to download the latest release of the troubleshoot binary. The step collect bundle runs troubleshoot to generate a bundle, the information that is collected in the bundle are provided here via a URL although there are other methods to retrieve them. The nice thing about using an online spec, as is done here, is you can continue to update and modify the information collected and your CI is always collecting relevant data. The two shown here are ones the Reliability Engineering team at Replicated maintain for our use. This is the team that is developing Troubleshoot and you can use this as well to get started if you like. The final step Upload support bundle artifact is Github specific and allows you to upload artifacts to retain after the run has completed.
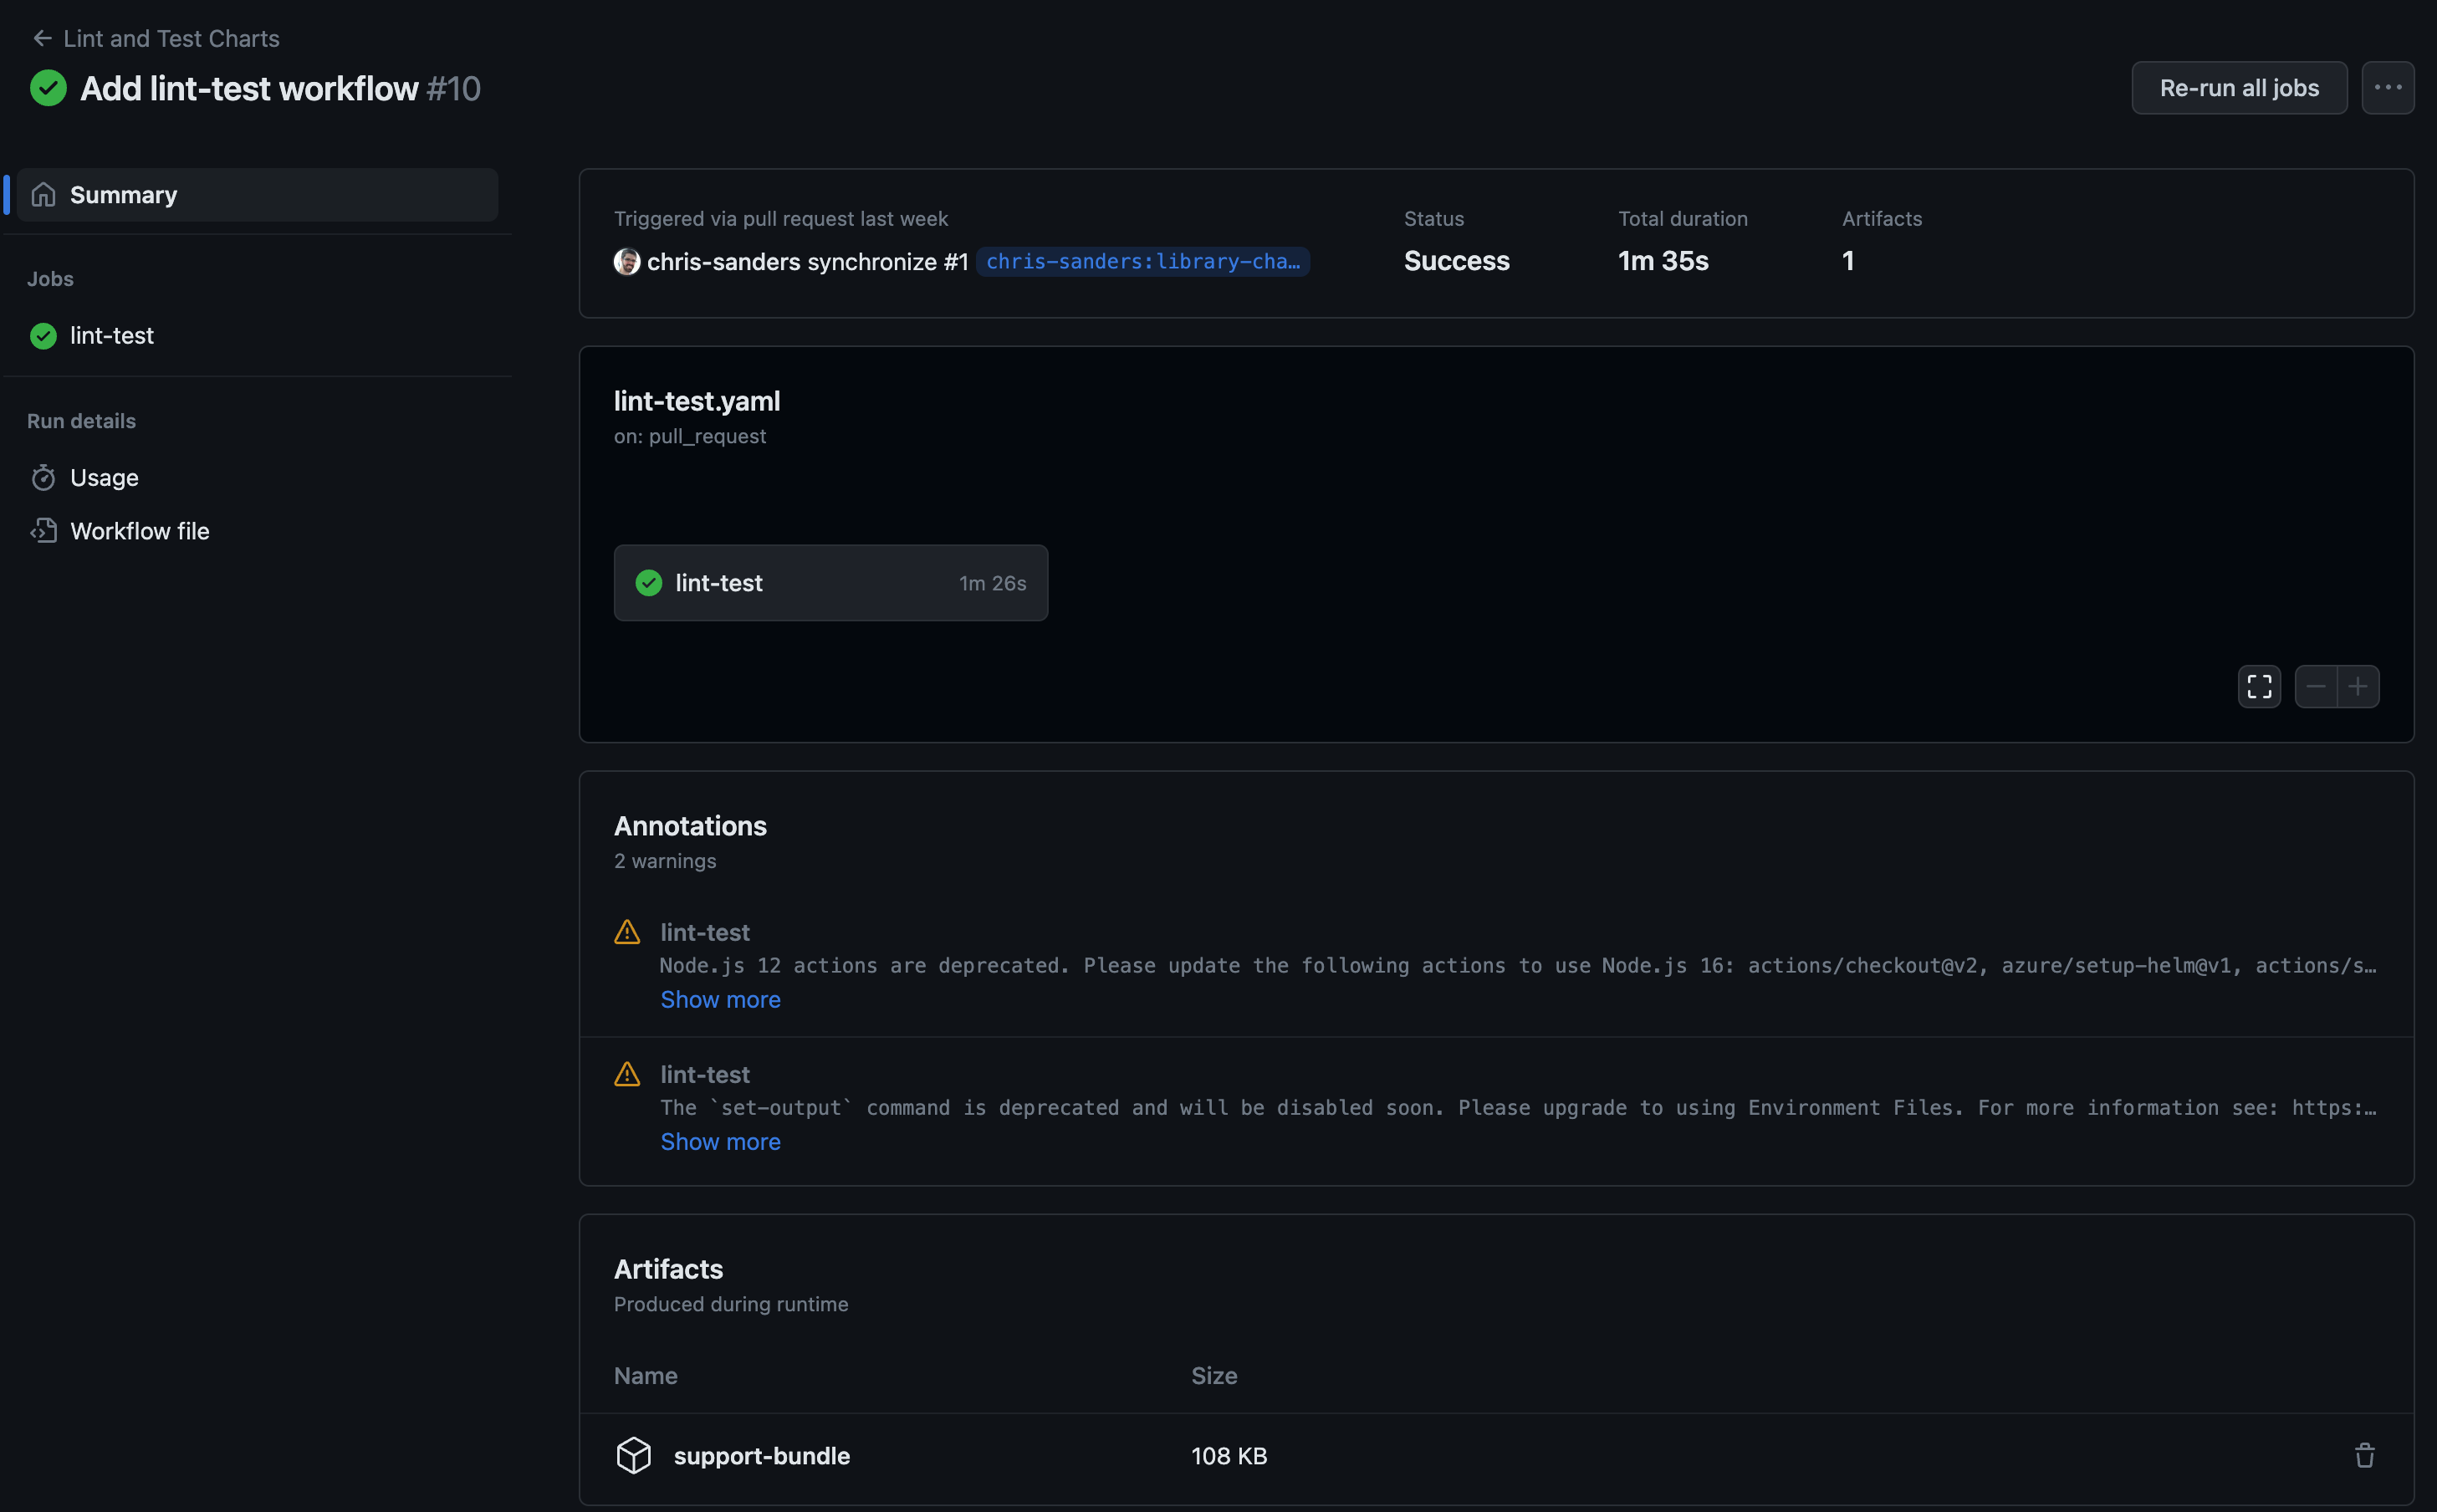
With these three steps, pass or fail, an artifact is created that you can review after the fact. Note the line if: success() || failure() which runs these actions pass or fail but not if the run is canceled all together. By default artifacts are stored for 90 days.
The artifact is listed at the bottom of the run summary shown here:
Sbctl
Once the support bundle is downloaded, you can unzip it to retrieve the ci-bundle.tar.gz support bundle file. While you can untar this file and browse through it’s contents that’s not very convenient. Instead we’ll use sbctl to use kubectl to review the cluster. Using the shell command tells sbctl to launch a sub-shell and set the KUBECONFIG in that shell for me, the serve command starts sbctl emulating an api-server, and the -s flag specifies a support bundle to operate on. Putting all of those together the command is:
sbctl shell serve -s ./ci-bundle.tar.gz
After which a you will have a shell you can execute kubectl against. Here’s an example, note the export statement was done by sbctl only the sbctl command and k get no commands were actually typed in the terminal by the user.
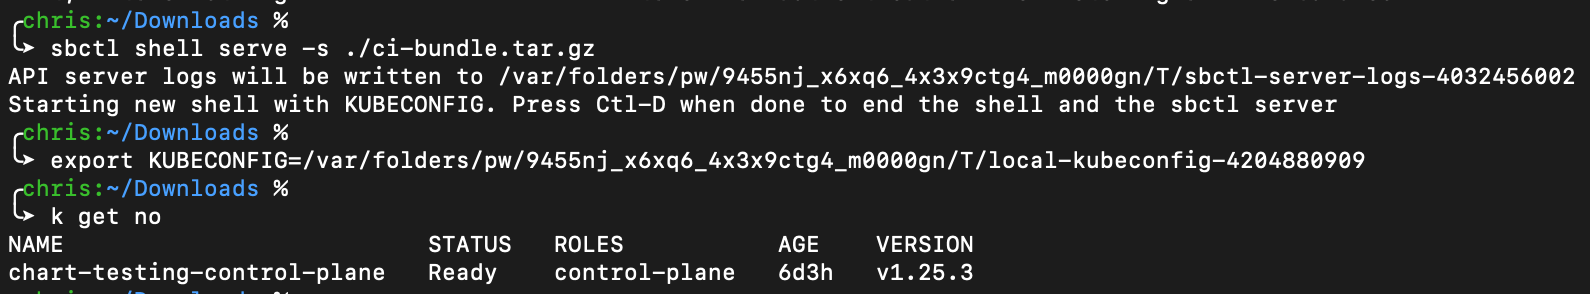
At this point I can use normal kubectl commands to look at the cluster and my deployment to figure out what happened. There is even host level information inside the ci-bundle.tar.gz file. Even though this runner has been destroyed some time ago I’m a file download and sbctl command away from browsing what it looked like.
Summary
While the above example is specific to Github there’s nothing about the use of troubleshoot that’s specific to this environment. Troubleshoot and sbctl together provide a way to capture what your cluster looked like during CI runs. With 13 lines of yaml I now have a fast way to introspect a failed CI by investigating a point in time snapshot of the exact failure environment.