Many technology projects stop at implementation and configuration. However, the ongoing care and feeding of that solution is also a very important and often overlooked aspect. This is especially true in the hobby and home lab environment. This post will cover how you can leverage juju and charms to easily setup monitoring for Ceph, with an example bundle to test out.
The tools
This article builds on the previously described ceph setup. I will include examples that do not require this specific setup, but I will be leveraging tooling I already have in place. That’s part of what I really enjoy about Juju. The initial effort required was a little higher, but the up front effort pays off. I won’t go over MAAS or Juju/Charms here again I’ll only discuss the new tooling I deploy.
Prometheus
Prometheus is an open-source monitoring tool particularly focused on storing multi-dimensional time series data in an efficient manor. Prometheus has several components and not all of them will be used in this setup. I will be using the server which handles scraping and storing the time series data from clients and alert manager which takes care of alerting.
While there are several options for storing time series data, Prometheus was chosen at Canonical as a forerunner. The inclusion of HA and Federation features allow for great expandability, the simple exporter format makes custom exporters easy to create, and out of box time series alerting allows it to cover another critical aspect with the same tool set.
Grafana
Grafana is an open source graphical front end for displaying data sets from a variety of data sources. One of the natively supported data sources is Prometheus. Grafana is a well supported data visualization tool and provides an easily configurable interface for visibility into the data that has been collected by Prometheus. I’ll be using it as the front end visualization for the monitoring data.
Telegraf
Telegraf is a Go agent for collecting metrics that supports a plugin system which has grown to include a wide variety of use cases. I’ll be using it to collect some additional metrics that are not application specific about hosts and containers. The data will be stored in Prometheus where it can then be included in Grafana dashboards
Ceph Exporter
Ceph Exporter is a Prometheus exporter developed at Digital Ocean to scrape information about a Ceph cluster for Prometheus. This will provide data specifically about the Ceph cluster to store in Prometheus.
Deploying it all
I learn best by doing, so let’s get right to a deployment bundle. The following bundle is an example that I have deployed on Google Compute. You can read about Using Google GCE with Juju and get started now for free. The JAAS (Juju As A Service) beta is free and Google offers $300 credit for a year which is more than enough for a year of testing. None of these links are referrals, it’s just what I’m using if you want to follow along.
series: xenial
services:
  ceph-osd:
    series: bionic
    charm: cs:ceph-osd
    num_units: 2
    storage:
      osd-devices: gce,32G,2
    options:
      osd-devices: "/dev/sdb /dev/sdc"
      bluestore: False
  ceph-osd-blue:
    series: bionic
    charm: cs:ceph-osd
    num_units: 1
    storage:
      osd-devices: gce,32G,2
    options:
      osd-devices: "/dev/sdb /dev/sdc"
      bluestore: True
  ceph-mon:
    series: bionic
    charm: cs:~chris.sanders/ceph-mon-0
    num_units: 1
    constraints: "instance-type=f1-micro"
    options:
      monitor-count: 1
      expected-osd-count: 3
  ceph-fs:
    series: bionic
    charm: cs:~chris.sanders/ceph-fs-1
    channel: edge
    num_units: 1
    options:
      fs-name: 'erasure'
      pool-type: 'erasure'
      pool-weight: 33
      erasure-profile: "single"
      erasure-plugin: "isa"
      erasure-failure-domain: "osd"
      erasure-k: 2
      erasure-m: 1
      # erasure-l: 3
      compression-mode: 'aggressive'
      compression-algorithm: 'zlib'
      compression-required-ratio: .25
  prometheus:
    charm: cs:prometheus2
    num_units: 1
  grafana:
    charm: cs:~chris.sanders/grafana
    num_units: 1
    series: xenial
    expose: True
    options:
      install_method: "snap"
  alertmanager:
    charm: cs:prometheus-alertmanager
    num_units: 1
    constraints: "instance-type=f1-micro"
  ceph-exporter:
    charm: cs:prometheus-ceph-exporter
    num_units: 1
  telegraf:
    charm: cs:telegraf
    series: bionic
  telegraf-xenial:
    charm: cs:telegraf
relations:
 - - "ceph-mon:osd"
   - "ceph-osd:mon"
 - - "ceph-mon:osd"
   - "ceph-osd-blue:mon"
 - - "ceph-fs:ceph-mds"
   - "ceph-mon:mds"
 - - "ceph-exporter"
   - "ceph-mon:client"
 - - "ceph-exporter:ceph-exporter"
   - "prometheus:target"
 - - "prometheus:grafana-source"
   - "grafana:grafana-source"
 - - "prometheus:alertmanager-service"
   - "alertmanager:alertmanager-service"
 - - "telegraf:prometheus-client"
   - "prometheus:target"
 - - "telegraf-xenial:prometheus-client"
   - "prometheus:target"
 - - "telegraf-xenial"
   - "ceph-exporter"
 - - "telegraf-xenial"
   - "alertmanager"
 - - "telegraf"
   - "ceph-fs"
 - - "telegraf"
   - "ceph-mon"
 - - "telegraf"
   - "ceph-osd"
 - - "telegraf"
   - "ceph-osd-blue"
 - - "telegraf-xenial"
   - "grafana"
 - - "telegraf-xenial:juju-info"
   - "prometheus"
To start the deploy put the above in a yaml file ‘gce.yaml’ and deploy with
juju deploy ./gce.yaml the deploy took less than 20 minutes. You can check
the status with watch -c juju status --color. There’s a lot going on here
so I’ll walk through it one peice at a time.
Grafana
You’ll notice that Grafana is exposed in this bundle so you can reach it remotely. To log in you’ll need to get the password with:
$ juju run-action grafana/0 get-admin-password --wait
unit-grafana-0:
  id: ecdf47ce-0c15-4554-8bf0-5ac63f5b3d7b
  results:
    password: Vq4Mqz3Nb2CHzL8W
  status: completed
  timing:
    completed: 2018-09-09 18:51:13 +0000 UTC
    enqueued: 2018-09-09 18:51:13 +0000 UTC
    started: 2018-09-09 18:51:13 +0000 UTC
  unit: grafana/0
The default user is setup with ‘admin’ and the password is the one that is retuned as you see above. This is the only part of the bundle that was exposed so it’s the only part you can access if deployed on a cloud provider.
After logging you’ll find four dashboards are available. These are installed by
the Grafana charm automatically based on the information it found available in
Prometheus. All of the dashboards installed by the charm are prefixed with
“[juju]”. Grafana checks for available metrics on install and once every 5
minutes. If a dashboard is not there initially, it might have not had any
metrics registered during the initial check. It will be picked up later. You can
force a check with juju run --unit grafana/0 './hooks/update-status'
Telegraf Host Metrics
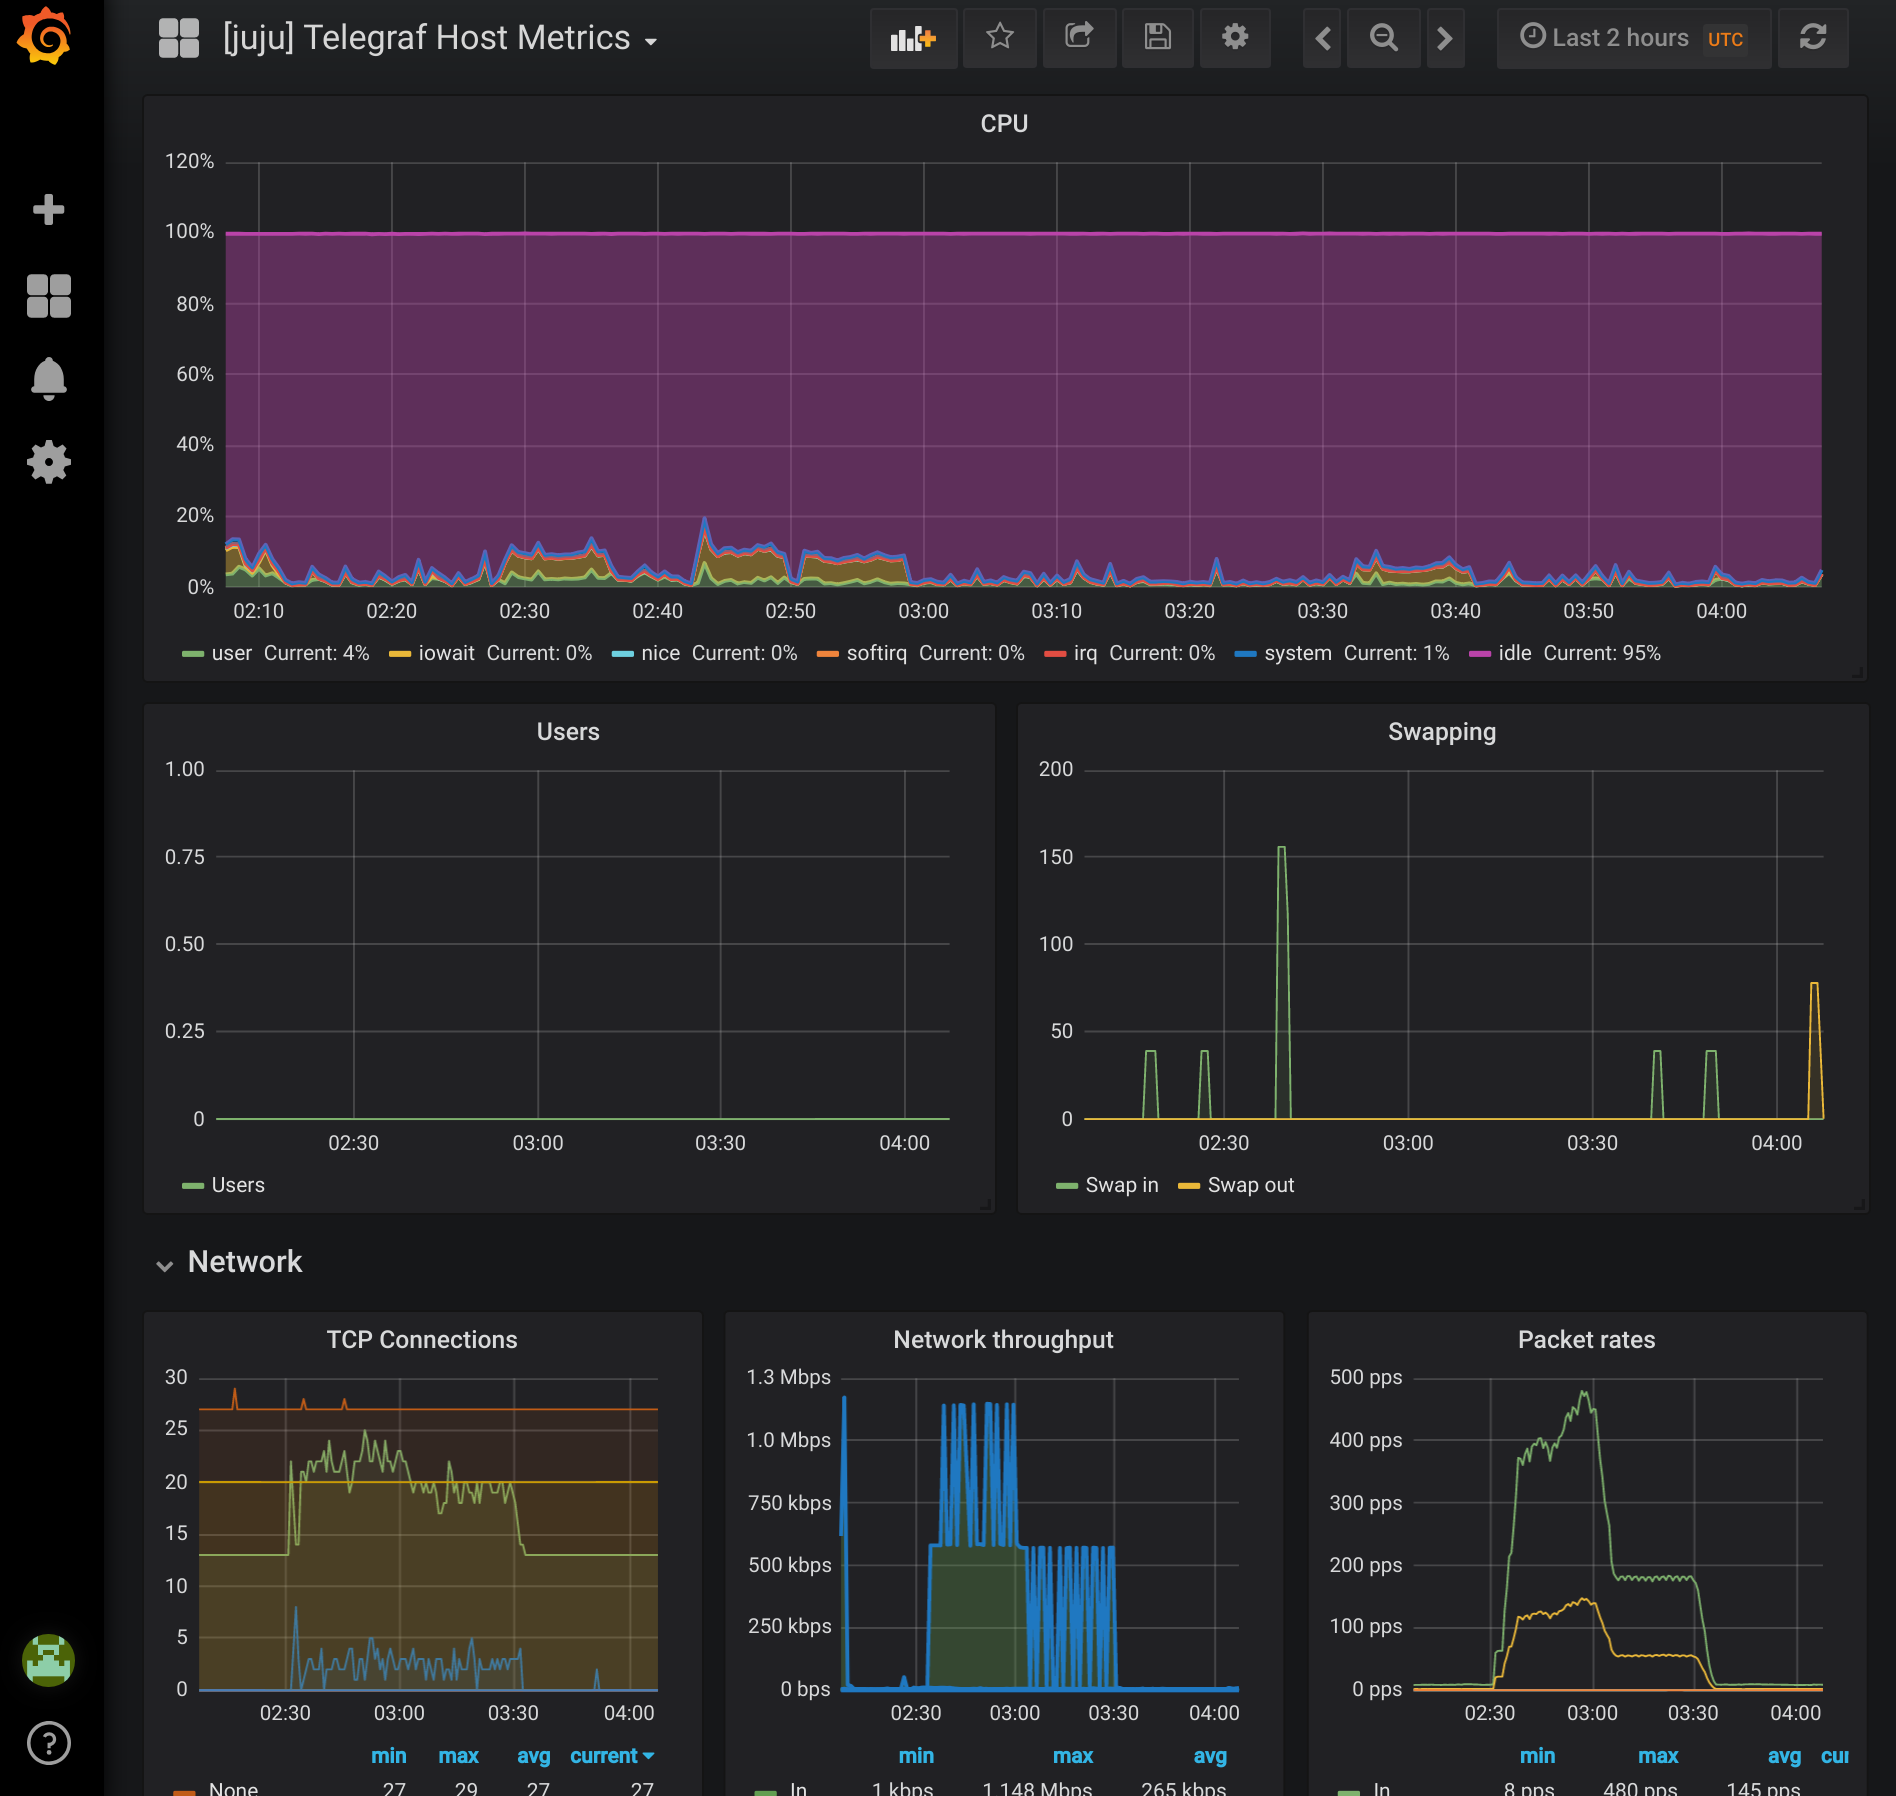
Telegraf provides metrics for host machines covering CPU/RAM/Network. The telegraf charm is a subordinate and is never installed on it’s own. Instead it is installed along with other charms by creating a relation to the application you want the telegraf agent installed with. In the example bundle telegraf is related to all of the applications to provide host metrics. Additionally, telegraf is also related to Prometheus to register the agents for scraping.
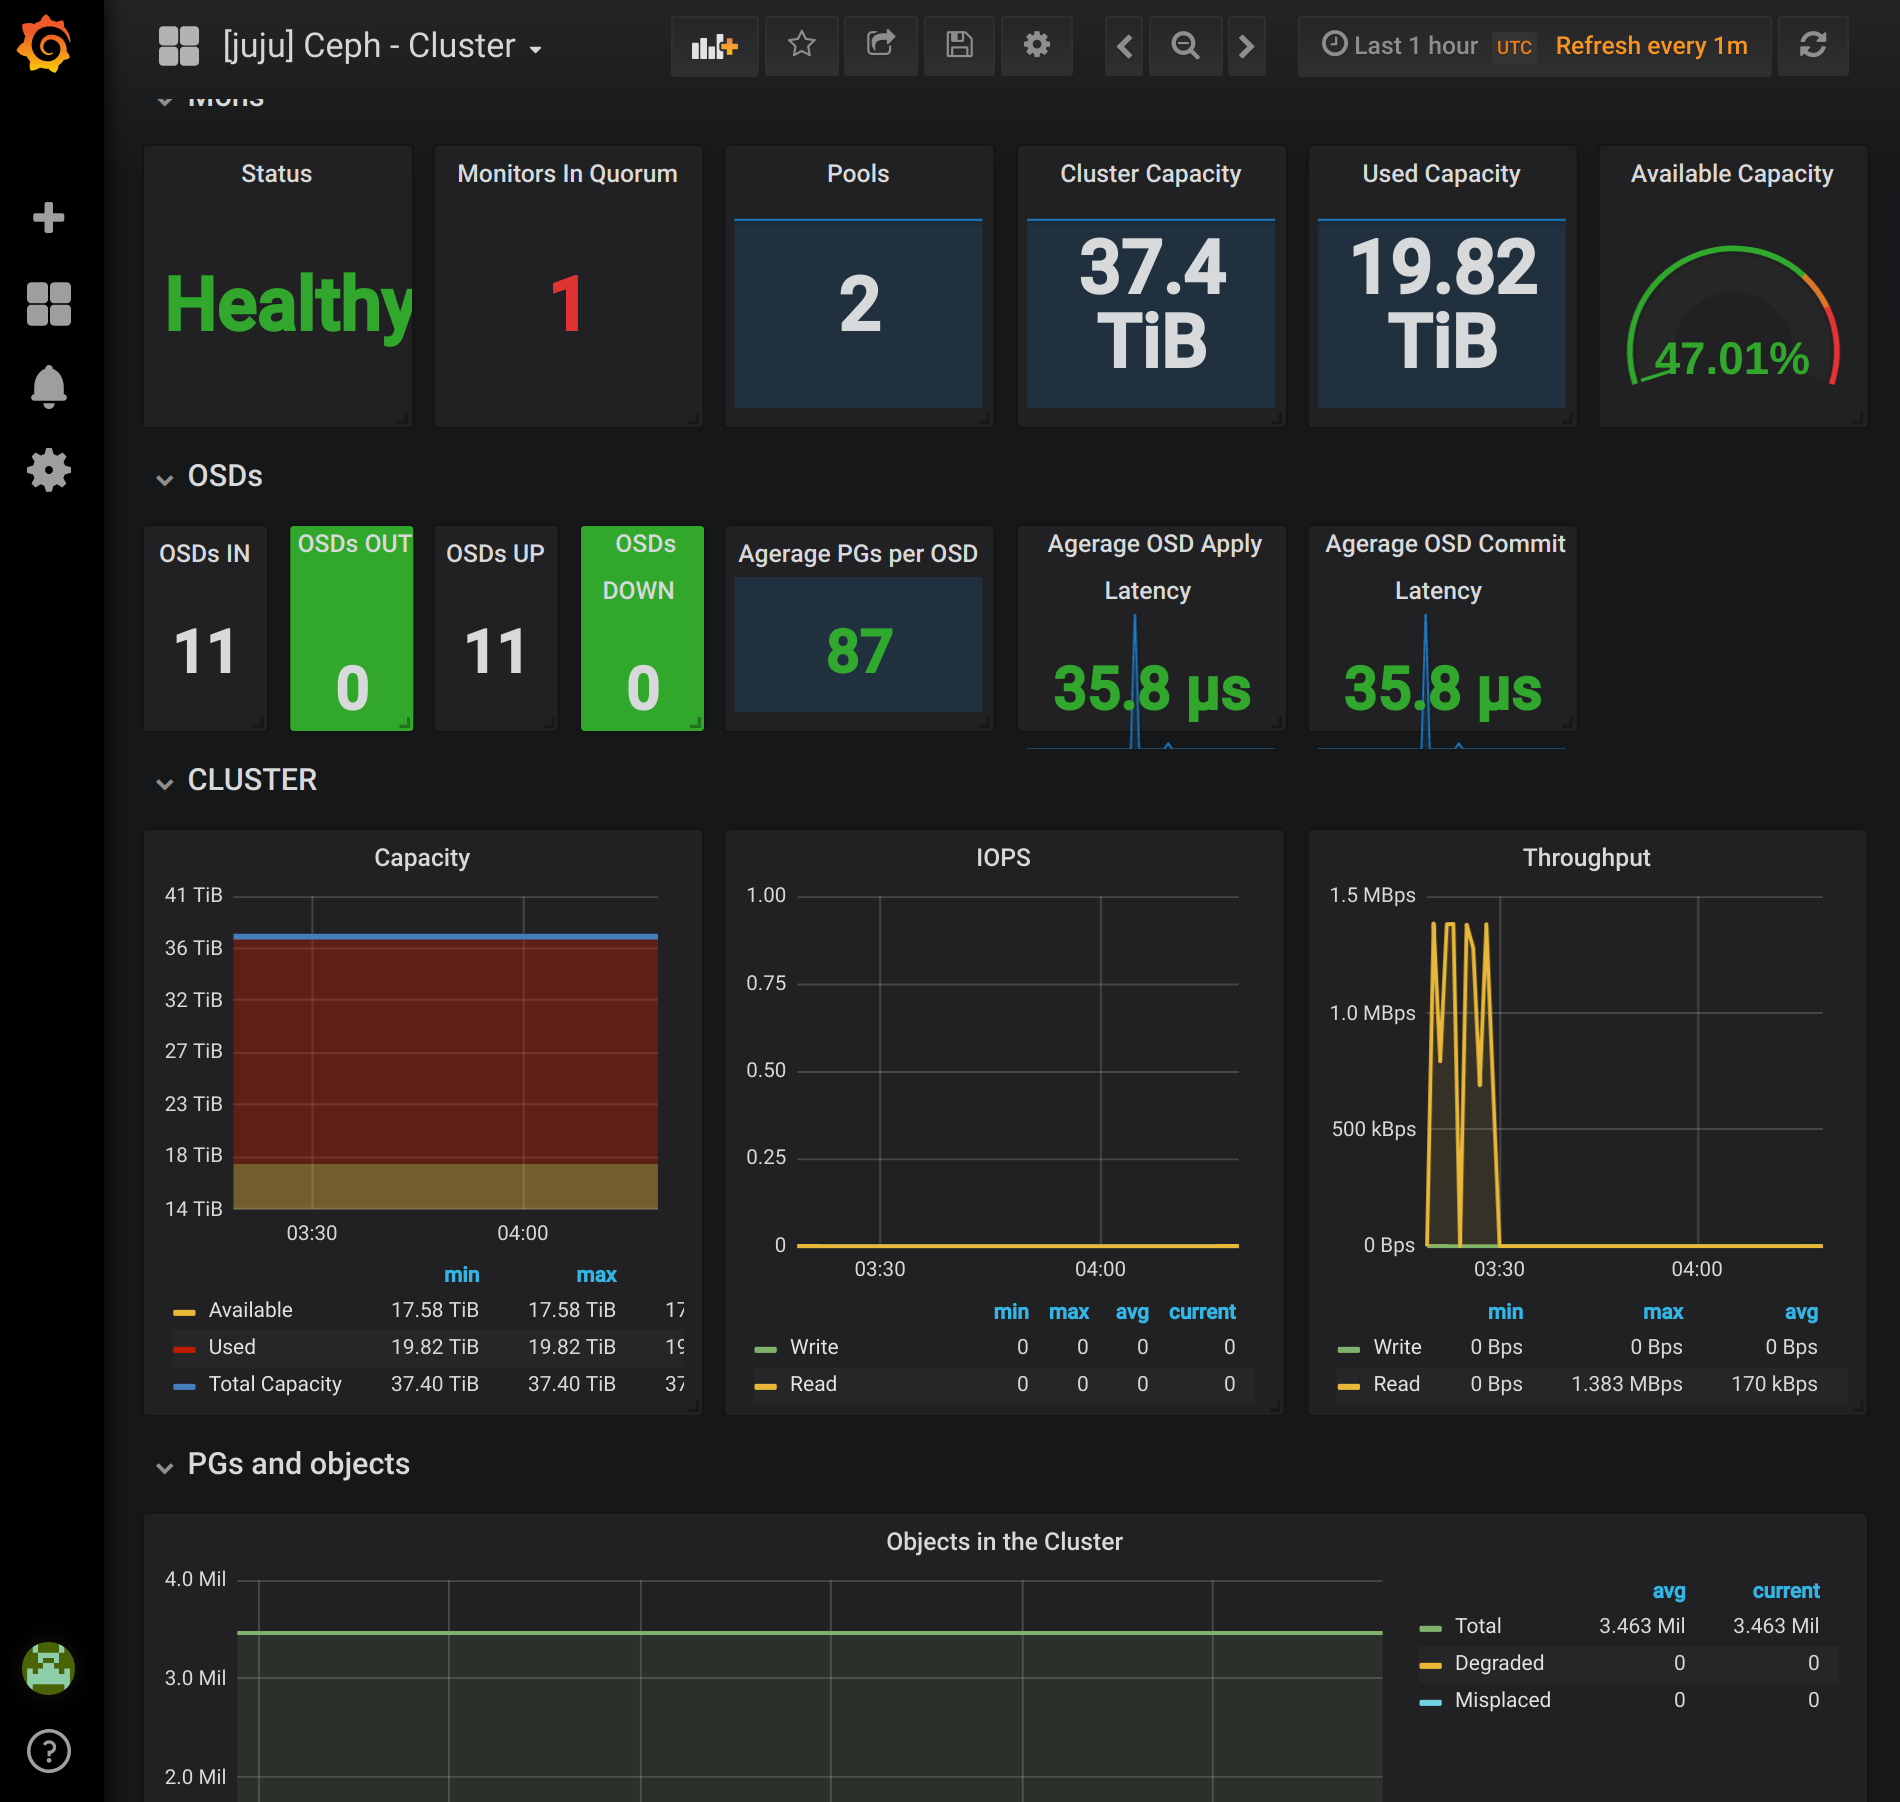
Ceph Cluster
Ceph Cluster is a dashboard that provides an overview of the health and utilization of the cluster. Data is provided by Ceph Exporter, which requires a relation to the Ceph Mon to generate the cluster data and Prometheus to register the agent for scarping. The example bundle installs one instance of the Ceph Exporter and both of the required relations.
Ceph Pools
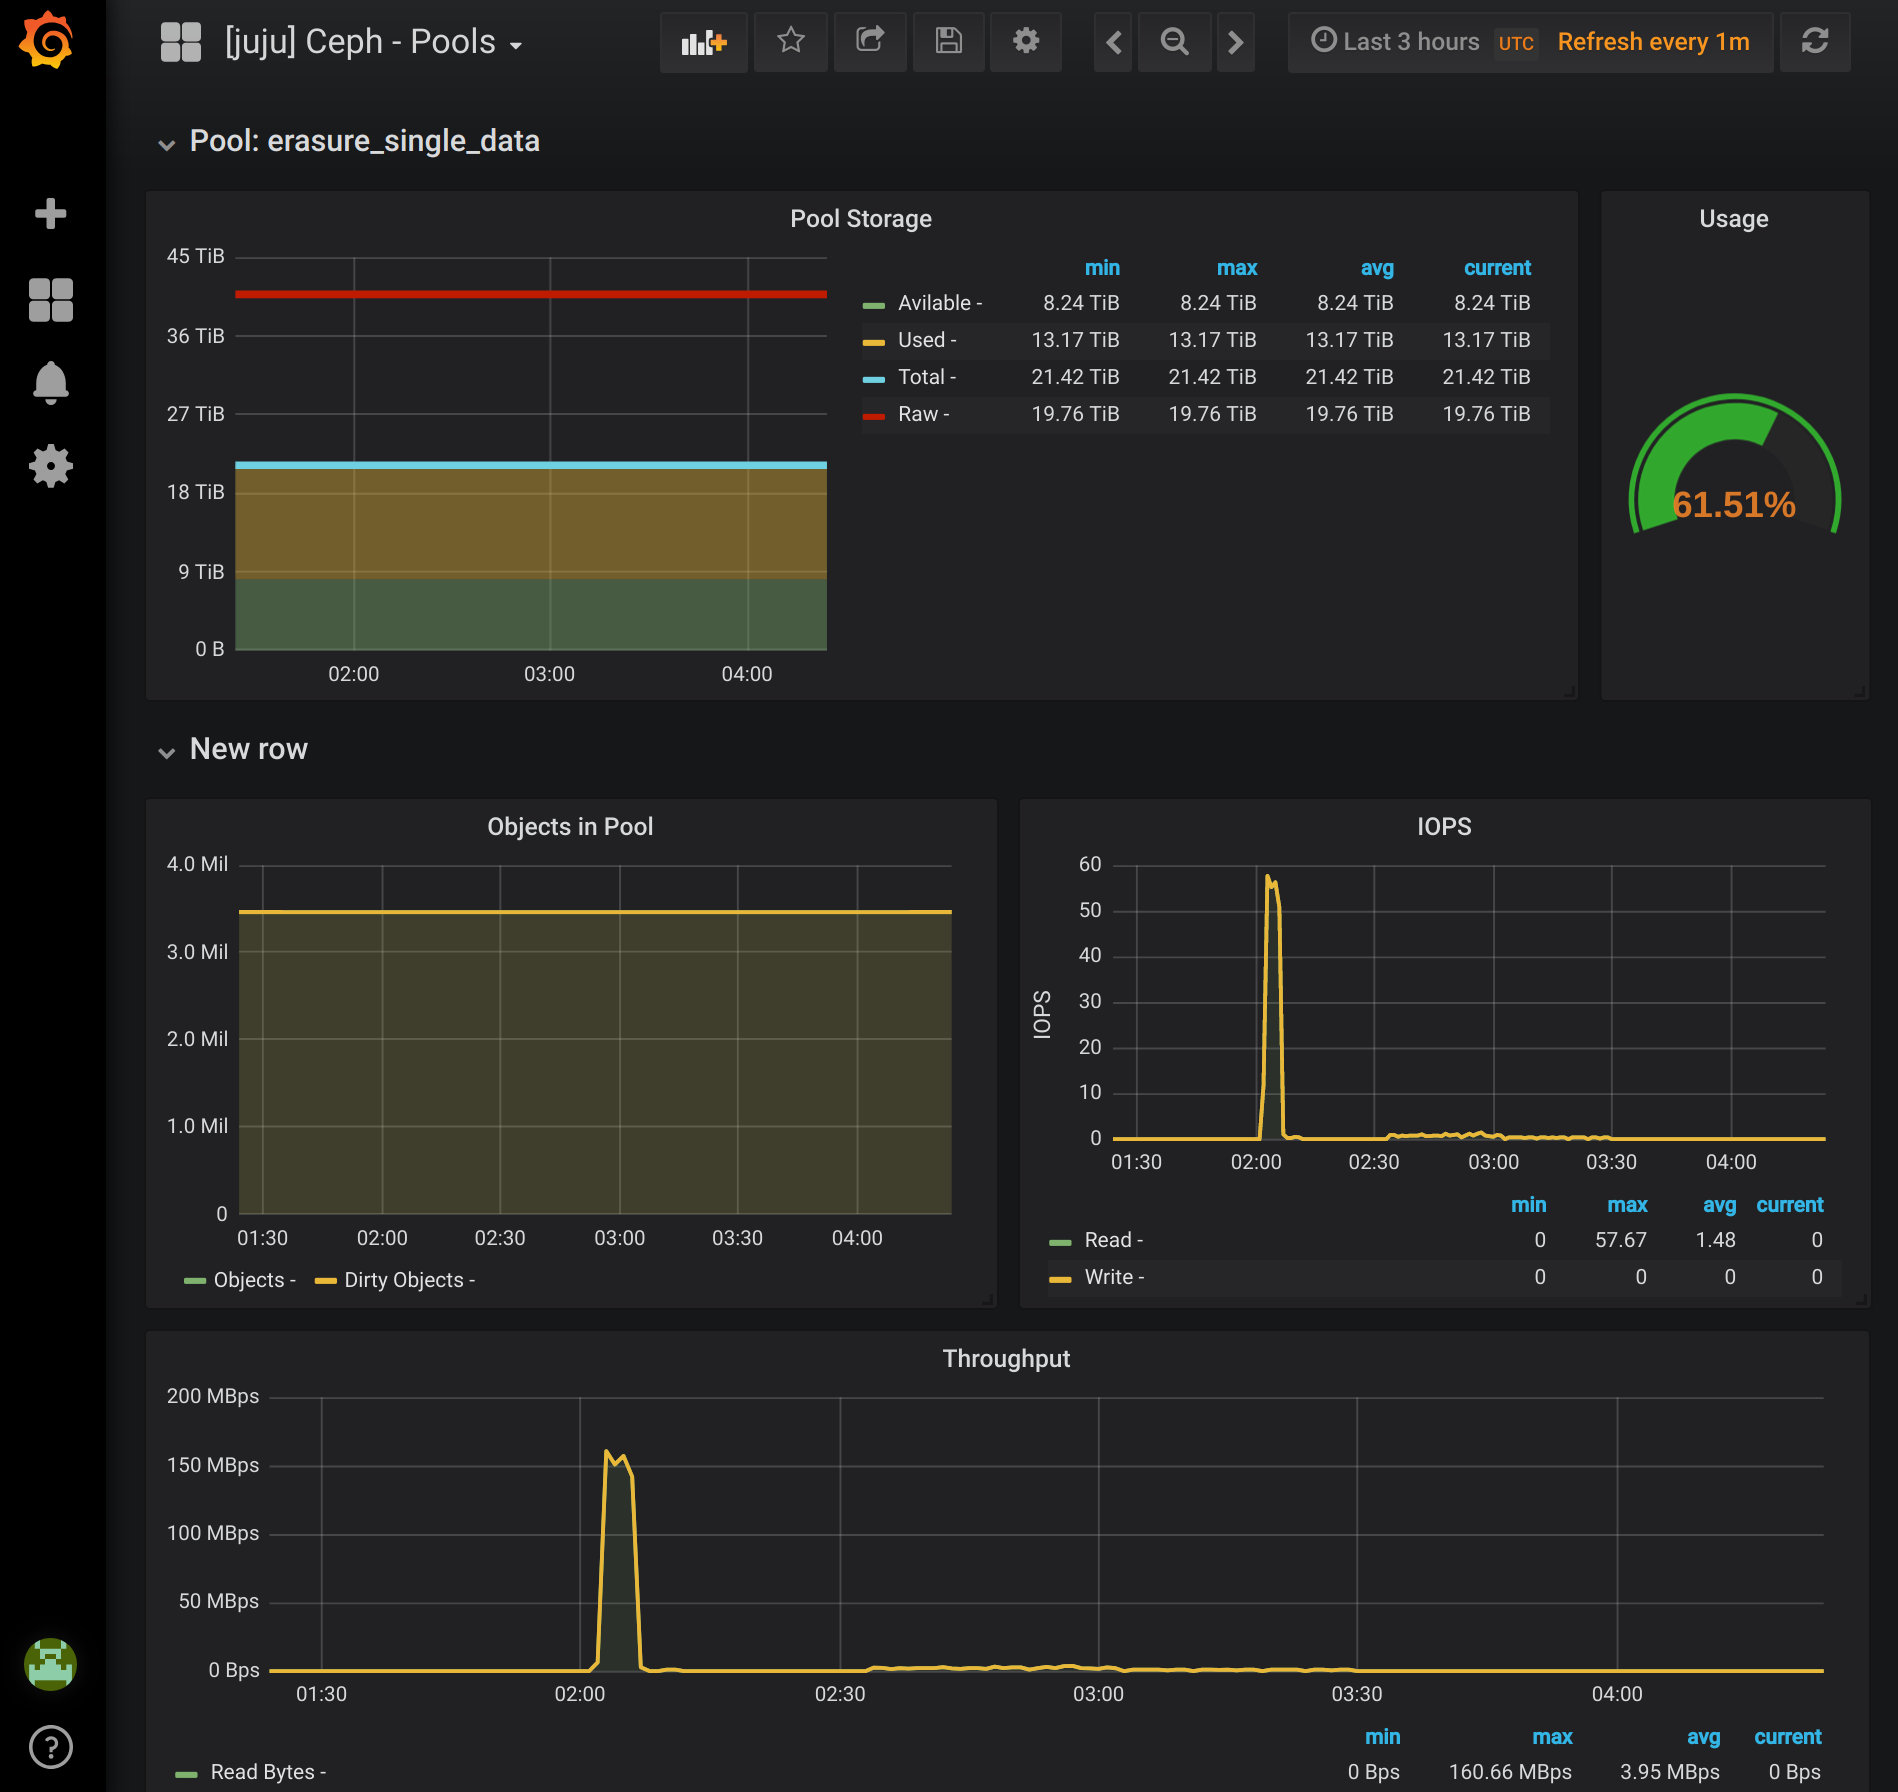
Ceph Pools provides information specific to a single pool. The information is also generated by the Ceph Exporter charm. No new charms are needed to generate this dashboard. Notice that information on this dashboard will be specific to the pool you have selected at the top. In the example bundle an erasure coded pool is installed you’ll see a difference in the Available storage for the two pools it creates. The metadata pool is replicated, while the data pool is erasure and the overhead difference is accounted for when Ceph reports available space for the pool.
Ceph OSD
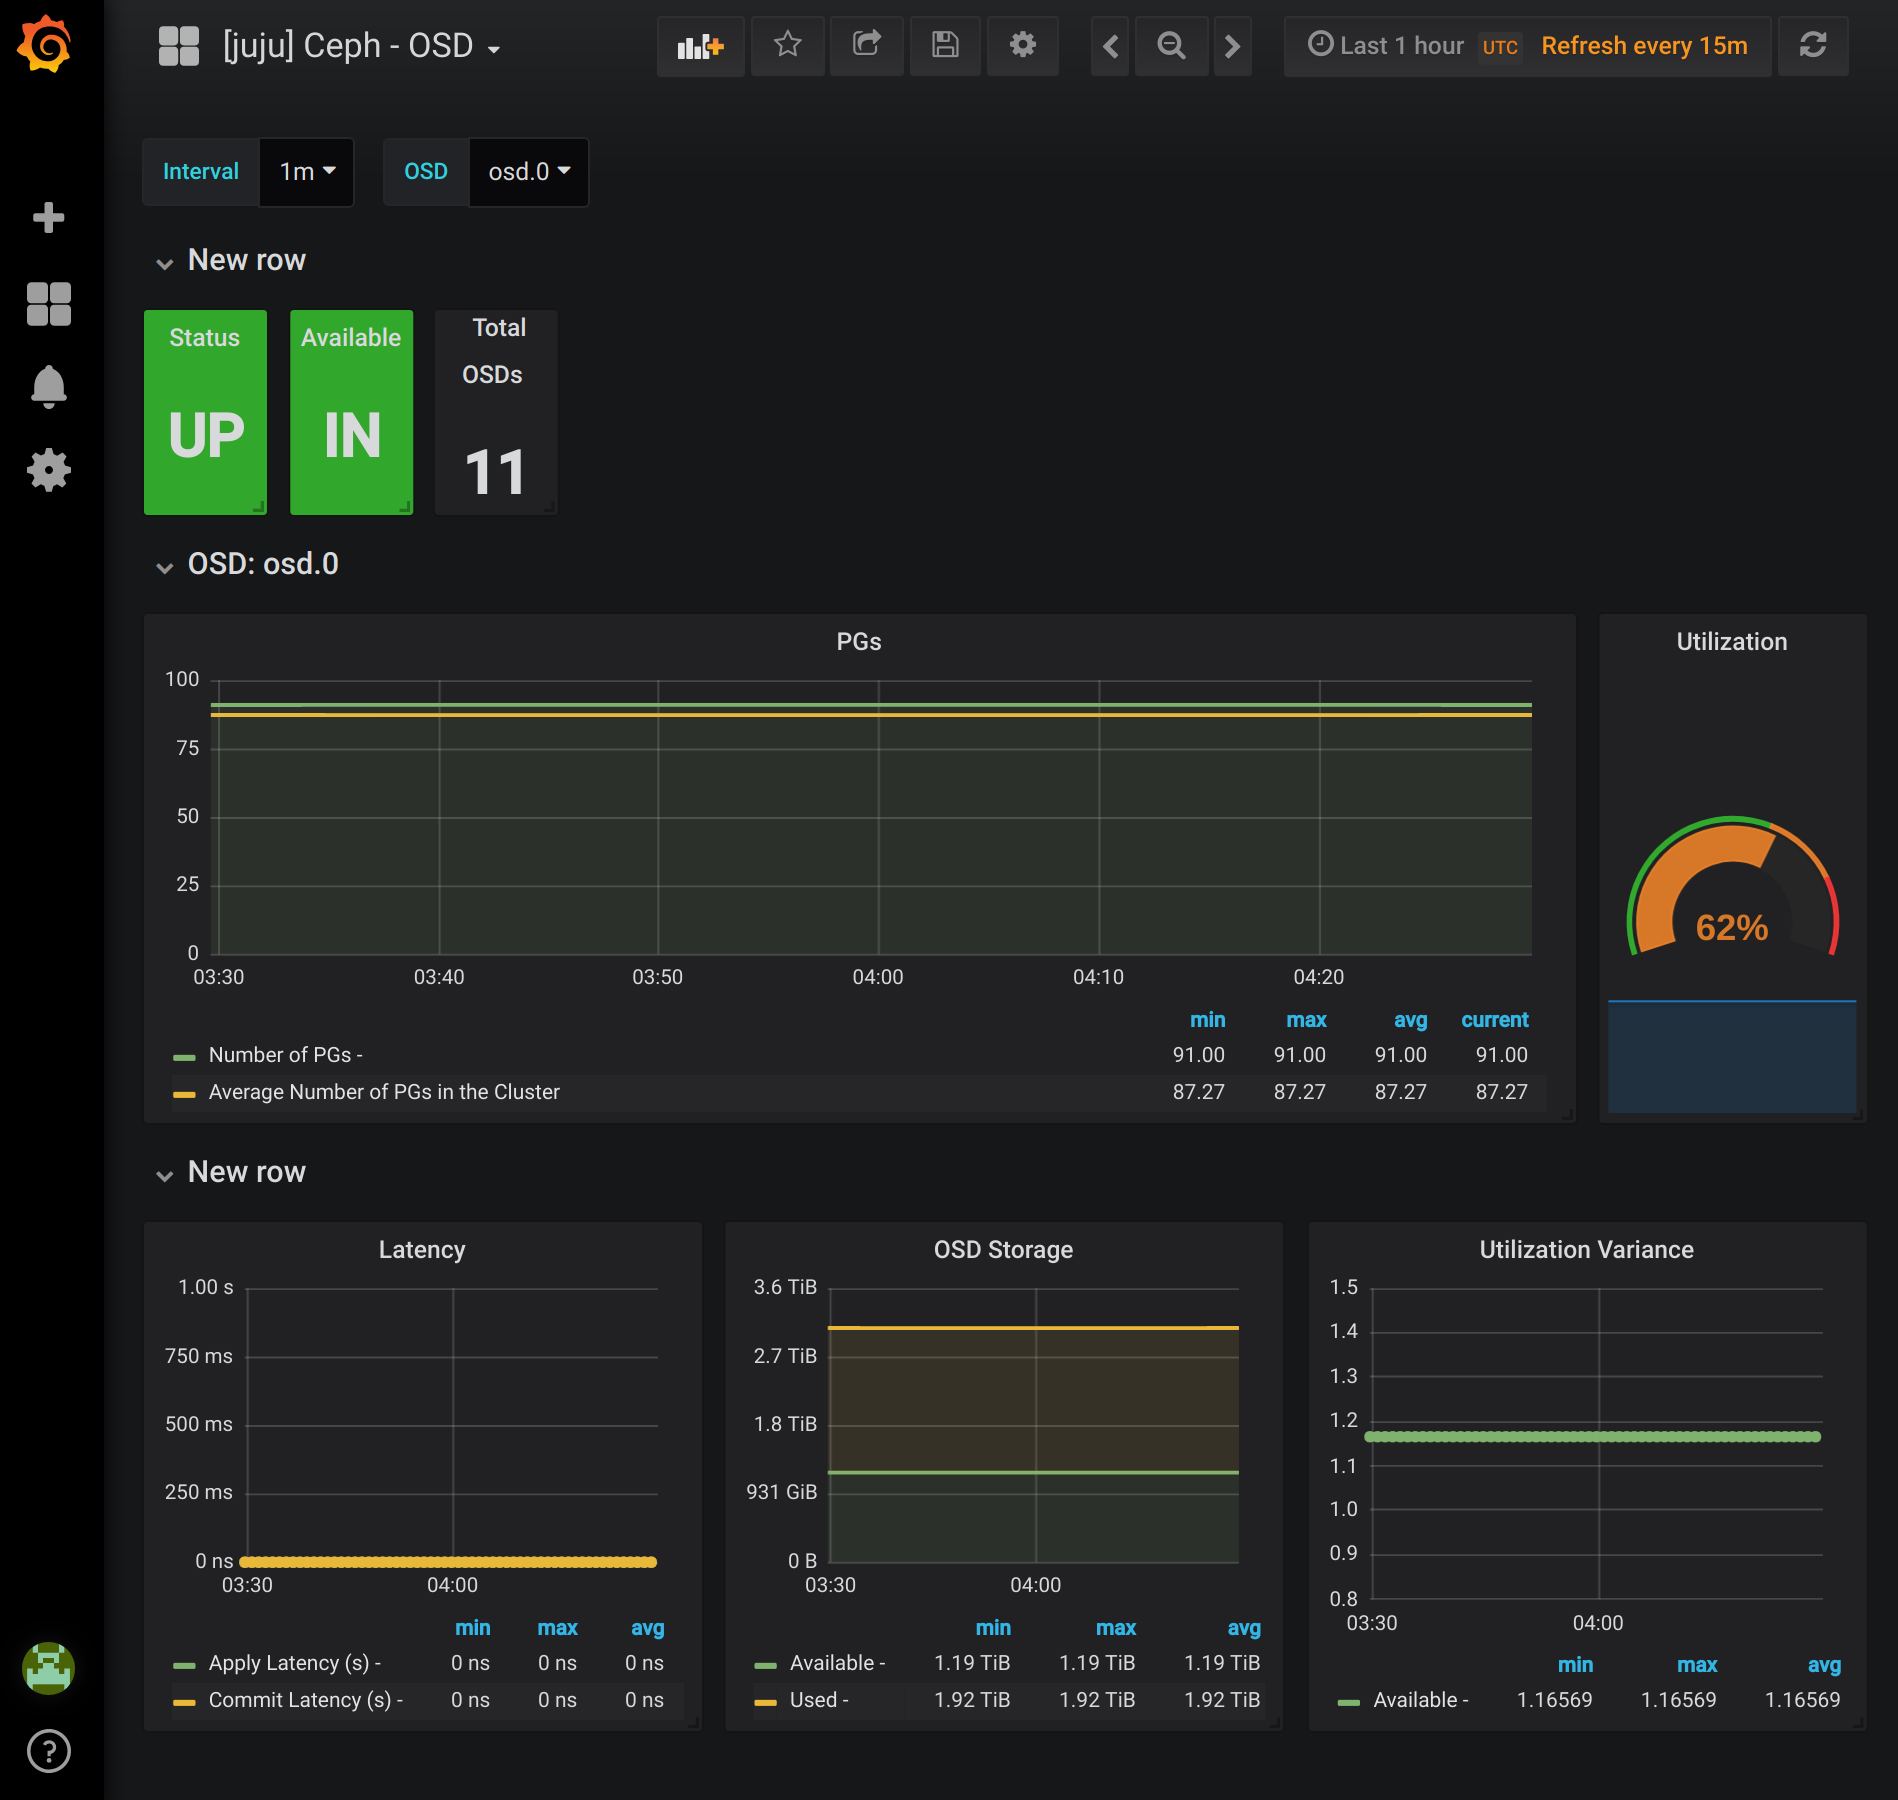
The Ceph OSD dashboard provides information for a specific OSD in the cluster. This allows you to look at the specific metrics for a single disk. All metrics from this dashboard are also made available by Ceph Exporter.
Custom Dashboards
The included dashboards are a good start for Ceph metrics. You aren’t however limited to only using these specific dashboards. Any data that’s being collected in Prometheus is available for querry to create custom dashboards. If you want to start with one of the included dashbaords as a template make a copy of it and edit the copy. The Grafana charm will check and restore the Juju created dashboards. Additionally, if new dashboards are added you can recive those by updating the Grafana charm.
The Charms
The example bundle includes a few charms that I have forked from their upstream versions.
Ceph
For the Ceph File system shown above, both the ceph-fs and ceph-mon charms have been forked. These two charms together allow the creation of erasure coded ceph filesystems and allow multiple file systems on a cluster. While I’m using both charms currently, you should be aware the changes have not been reviewed up stream yet. These changes do not affect the ceph-osd charm which is used in the bundle for both a Filestore and Bluestore install.
The ceph-osd charms do include disk definitions that are specific to GCE. If you
deploy somewhere else you should alter the osd-devices configuration to
match the size and number of disks you want to deploy.
Grafana
I have also forked the Grafana charm from up stream. With this charm I’ve modified the Telegraf Host dashboard to not require bcache and bonded NIC’s. If you have both of those available you do not require this fork. If you are missing those items you would need to run this fork for the Telegraf dashboard to install. This is a very recent fork which I expect to be reviewed up stream in a few weeks at most. There is very little risk to using this fork, Grafana holds no persistant data and could be replaced with a different charm version entirely if needed.
Prometheus
The Prometheus charm is using the recommended version. Pay attention to the actual charm as the prometheus2 charm is a newer version than the prometheus charm. The former is the latest version and an upgrade path from the old charm was not provided.
The alert manager charm was installed with a GCE specific constraint for the instance type. This is not required, but the alert manager does not requires significant resources so I included it. You could remove the constraint and a larger machine would be used. If deploying on another provider either remove or modify the constraint accordingly.
Closing Remarks
This bundle provides a good starting point for monitoring a juju deployed Ceph cluster. This also uses charms in use, and still in development, by Canonical for our operations teams. I expect changes and improvements will continue to be added benefiting everyone using charm based installation of these tools.
While I have included the installation of Alert Manager with this bundle, I have not covered configuration of alerting. I intend to cover that in a later post, until then the necessary configurations are available on the Charm if you want to test it out. These charms do not currently define alerts and the user will have to define them. The alert manager charm is in development still and automatic configuration of a baseline set of alerts will likely be added but is not available at this time.