Benchmarking is notoriously hard to do correctly, I’m going to provide the raw results of many hours of benchmarks. I’ll draw some conclusions specifically comparing performance on my hardware, hopefully it provides some insight for single node Ceph on commodity hardware for anyone else considering this setup.
Specifically I’m looking to compare:
- Bluestore vs Filestore
- Replicated vs Erasure
- Performance impact of a slow drive in the array
Hardware
A full inventory of the hardware can be found in the repository in the file hardware.yaml. These tests are on a Supermicro X8DTN with two hyper threaded hex core processors and 144 GiB of ram. This chassis supports 12 SATA hard drives, four are in use for benchmarking. The first two hard drives are setup with a raid 1 for the host OS as well as Ceph OSD. The second two drives are only used as OSDs. The drives are all on an Adaptec Raid 5405Z, configured as single drive raid (JBOD can not be used to boot on this card).
- Drive 0: IronWolf 4TB
- Drive 1: HGST 4TB
- Drive 2: WD Black 640 GB
- Drive 3: ?? 400 GB
Tests will be done with and with out the 3rd drive, which is a much older drive I had available for testing. Only drive 0 was purchased for this build, the rest are repurposed. Hopefully this provides a good overview of how a single node will perform as it expands with mixed hardware.
Testing
All of the testing has been done with fio. Each run has several logs available.
- [configuration].fio - the configuration for the run
- [RW]-[BS].out - command line output for a run with the given RW setting and Block Size.
- *.log - FIO log files during the run
- *.png - Graphs created with fio2gnupg
Hard Drive FIO
To start I’ve measured the four drives directly, you can find all of the results in the hdd folder.
| Drive | write-4k | read-4k | rw-4k |
|---|---|---|---|
| 0 | 100.52 MB/s | 60.11 MB/s | 35.22 / 35.18 MB/s |
| 1 | 101.72 MB/s | 105.26 MB/s | 43.10 / 43.06 MB/s |
| 2 | 100.92 MB/s | 70.24 MB/s | 37.10 / 37.06 MB/s |
| 3 | 77.19 MB/s | 42.37 MB/s | 25.08 / 25.07 MB/s |
| Drive | write-1M | read-1M | rw-1M |
|---|---|---|---|
| 0 | 115.80 MB/s | 135.93 MB/s | 56.62 / 54.08 MB/s |
| 1 | 120.94 MB/s | 135.86 MB/s | 59.56 / 57.34 MB/s |
| 2 | 112.08 MB/s | 112.32 MB/s | 50.00 / 47.75 MB/s |
| 3 | 77.44 MB/s | 52.87 MB/s | 24.93 / 23.26 MB/s |
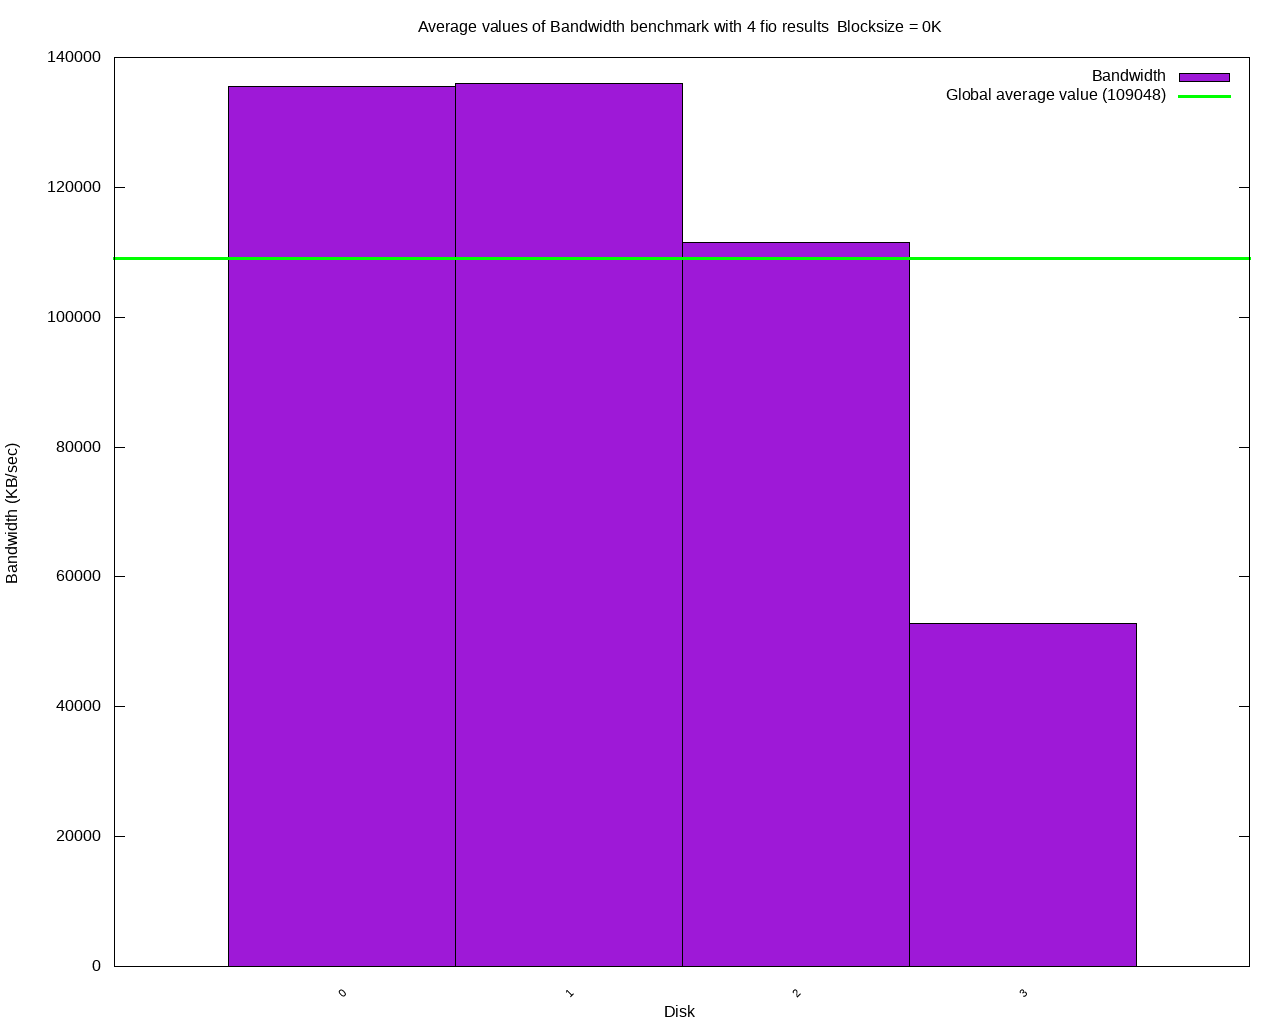
As expected, Drives 0 and 1 perform similarly and outperform Drive 2 and 3. Drive 3 is showing it’s age, which will make for some interesting comparisons with and with out the drive in Ceph pools. Additionally, the 1M block size shows significantly better performance than the 4k, with Drive 0 showing an unexpectedly large reduction in 4k performance compared to Drive 1.
Taking a look at the average 1M read results from gnuplot shows the difference
in performance across the drives.
Filestore vs Bluestore
With the base hardware numbers complete, let’s move on to comparing Filestore vs Bluestore. In this comparison I’ll only be comparing Replicated pools because Filestore doesn’t support Erasure pools without a cache layer. Additionally, testing is being done over the network with the kernel driver. Across all testing scenarios the Fuse driver performed poorly in comparison to the in kernel driver.
| Store | randomwrite-4k | write-1M | read-1M | rw-1M |
|---|---|---|---|---|
| Filestore | 268 iops, 1074 KB/s | 44.27 MB/s | 114.74 MB/s | 42.08 / 42.17 MB/s |
| Bluestore | 189 iops, 757 KB/s | 46.72 MB/s | 104.40 MB/s | 33.72 / 33.04 MB/s |
Next with only the top 3 drives.
| Store | randomwrite-4k | write-1M | read-1M | rw-1M |
|---|---|---|---|---|
| Filestore 3 drive | 259 iops, 1039 KB/s | 41.06 MB/s | 114.79 MB/s | 42.57 / 42.71 MB/s |
| Bluestore 3 drive | 267 iops, 1071 KB/s | 64.87 MB/s | 112.18 MB/s | 41.14 / 39.51 MB/s |
Bluestore vs Filestore Results
The numbers above are the aggregates from the onejob benchmarks for Filestore and Bluestore with replicated pools. The new Bluestore doesn’t fair well in this test. The results are mixed but Filestore has a slight advantage, providing better read results while also performing more consistently across the 3 and 4 drive tests. It is interesting to note with the 3 best drives Bluestore shows a marked improvement in the sequential write over Filestore, indicating Bluestore Replicated pools are more affected by a slow drive than Filestore. It’s possible that has something to do with the PG distribution of each setup, if that is the configuration you are using more detailed testing should be done.
Replicated vs Erasure
With the introduction of Bluestore erasure pools can now be created directly with out a cache pool. Erasure provides a configurable overhead and failure domain. Let’s see what the performance cost is for the extra flexibility.
With Erasure coding the K value is the number of data chunks and M is the number of parity chunks. You can loose M drives without loosing data.
| Store | randomwrite-4k | write-1M | read-1M | rw-1M |
|---|---|---|---|---|
| Filestore | 268 iops, 1074 KB/s | 44.27 MB/s | 114.74 MB/s | 42.08 / 42.17 MB/s |
| BS Replicated | 189 iops, 757 KB/s | 46.72 MB/s | 104.40 MB/s | 33.72 / 33.04 MB/s |
| BS K2,M1 | 128 iops, 512 KB/s | 83.36 MB/s | 95.05 MB/s | 63.67 / 66.25 MB/s |
| BS K2,M2 | 116 iops, 464 KB/s | 69.12 MB/s | 107.31 MB/s | 49.80 / 48.19 MB/s |
Next with only the top 3 drives.
| Store (3 drive) | randomwrite-4k | write-1M | read-1M | rw-1M |
|---|---|---|---|---|
| Filestore | 259 iops, 1039 KB/s | 41.06 MB/s | 114.79 MB/s | 42.57 / 42.71 MB/s |
| BS Replicated | 267 iops, 1071 KB/s | 64.87 MB/s | 112.18 MB/s | 41.14 / 39.51 MB/s |
| BS K2,M1 | 134 iops, 536 KB/s | 93.87 MB/s | 96.53 MB/s | 44.38 / 44.28 MB/s |
Replicated vs Erasure Results
I expected to see a reduction in write performance, at least on the 4k writes due to the erasure overhead. The random 4k write performance then is not surprising. However, the 1M block size numbers are interesting. Not only was the Erasure faster than Replicated, it’s a lot faster. The 1M block size read performance is close but you’ll note that Filestore reads are capped by the 1G network, in this case the network makes the Erasure overhead less noticeable.
When used with a 2 drive failure domain Erasure is comparable to the Replicated pool, and supports the 1 drive failure domain for significantly lower overhead and better write performance. For large block size writes with a few more drives the Erasure pool will likely become network limited matching the Replicated pool read performance with lower hard drive overhead.
Note: These conclusions are for 1G networking. The filestore-lxd read test performed in a LXD container with 4 processes to remove the network bottleneck was able to bench at 488.84 MB/s. Any conclusions here are focused on 1G networks. Results at ~112-114 MB/s should be considered network capped.
Conclusions
For the use case of a single node home storage solution, Erasure coded Bluestore pools perform adequately for storing medium to large files. While read performance isn’t as good as a Filestore Replicated pool, the network is only 1G providing a ~125 MB/s theoretical cap. Even with a small 3 or 4 drive pool the Erasure is close to the network cap on reads and outperforms Filestore on medium/large block size writes. Performance on 4k writes is pretty bad across the board which is worth being aware of. In the future adding an SSD for bcache or journaling to accelerate the 4k writes would make for an interesting comparison and should significantly improve performance in that area.
These tests show a single Ceph node that can expand from 3 to 12 drives easily like Unraid, provide equal or better failure domain to ZFS, does full checksums like ZFS, has a lower hard drive overhead, and can expand horizontally to more Ceph nodes in the future. Additionally, it’s running a full Ubuntu base that can easily deploy more software in LXD containers operating as a compute node.
These benchmarks are good enough that I plan to continue setting up a single node Ceph for home storage. Since my current deployment was intended specifically for benchmarking, I plan on testing a path for safe upgrades so the changes can be run with a reasonable expectation of future upgrades without data loss.